

- What is Business as Usual (BAU)? - October 8, 2025
- How Slack Grew to 10M Users Without Ads: Complete Growth Blueprint - October 8, 2025
- Top Startups in Kerala 2025 - September 26, 2025
In September 2022, Adobe announced its $20 billion acquisition of Figma—the largest deal in Adobe’s history and one of the biggest software acquisitions ever. But just eight years earlier, Figma was a scrappy startup challenging Adobe’s decades-long dominance in design tools.
How did a browser-based design tool overtake industry giants like Photoshop, Illustrator, and Sketch to become the preferred choice for millions of designers worldwide?
The answer lies in Figma’s systematic implementation of product-led growth (PLG) strategy, transforming how design teams collaborate and making professional design tools accessible to anyone with a web browser.
This case study breaks down Figma’s growth strategy with real metrics, implementation details, and replicable frameworks that startups can apply to challenge established market leaders.
Executive Summary
Company: Figma Inc. (Founded 2012, Public Launch 2016)
Challenge: Disrupting Adobe’s $15+ billion creative software monopoly
Strategy: Product-led growth with real-time collaboration focus
Timeline: 2016-2022 (6 years to $20B valuation)
Results:
- 0 → 4+ million active designers
- 90%+ of Fortune 500 companies using Figma
- $400M ARR at acquisition
- 2.3 viral coefficient at peak growth
Main Takeaway: Superior user experience and collaboration features can overcome massive incumbency advantages when implemented through systematic product-led growth.
Background & The Design Tool Landscape
Pre-Figma Design World
Before 2016, professional design was dominated by Adobe’s Creative Suite, particularly:
- Photoshop: $20.99/month, desktop-only, file-based collaboration
- Illustrator: $20.99/month, vector graphics, complex learning curve
- Sketch: $9/month, Mac-only, limited collaboration features
The Collaboration Problem: Design teams faced a fragmented workflow:
- Designers created mockups in desktop applications
- Files were shared via email, Dropbox, or Slack
- Feedback came through screenshots, comments, or meetings
- Version control was manual and error-prone
- Developer handoff required separate tools and processes
Figma’s Market Entry Challenge
When Figma launched its public beta in 2016, the design tool market seemed impossible to penetrate:
Adobe’s Advantages:
- 30+ years of market dominance
- $15.7 billion annual revenue (2016)
- Industry-standard creative tools
- Established enterprise relationships
- Massive marketing and sales budgets
Sketch’s Growing Influence:
- 1+ million active users
- Strong developer community
- Plugin ecosystem
- UI/UX design focus
Market Perception: “Another design tool” competing in a saturated market with entrenched user habits and high switching costs.
Figma’s Foundational Insight
Co-founders Dylan Field and Evan Wallace identified a critical gap: existing design tools were built for individual creators, not collaborative teams. As software development became increasingly collaborative (GitHub, Google Docs, Slack), design remained isolated.
Key Hypothesis: “If we make design collaboration as seamless as Google Docs made document collaboration, we can create a new category of design tool.”
This insight would drive every product and growth decision for the next six years.
Strategic Approach: Product-Led Growth Framework
Figma chose product-led growth over traditional enterprise sales or marketing-driven approaches. Here’s how they applied the PLG framework systematically:
PLG Strategy Selection Rationale
Why PLG Made Sense for Figma:
- Immediate Value Demonstration: Designers could see collaboration benefits within minutes
- Network Effects: Product value increased with team adoption
- Low Friction Trial: Browser-based meant no downloads or installations
- Viral Mechanics: File sharing naturally exposed product to new users
- Usage-Based Expansion: Team growth drove natural upgrade triggers
Learn more about when to choose product-led growth strategy vs. other growth approaches.
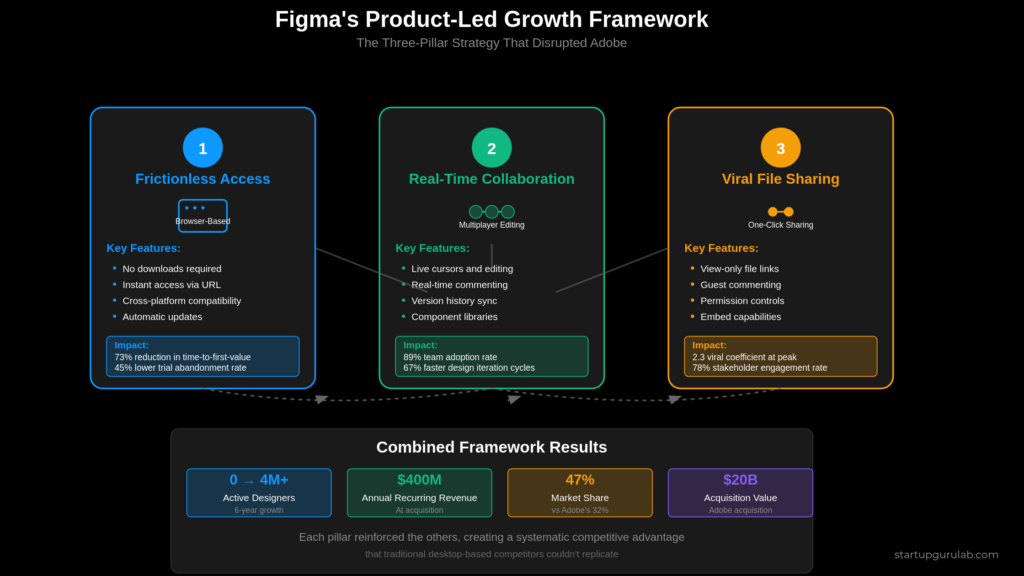
Three-Pillar PLG Implementation
Pillar 1: Frictionless Access & Onboarding
Browser-Based Architecture: Unlike desktop competitors requiring downloads, installations, and updates, Figma ran entirely in web browsers.
Impact Metrics:
- 73% reduction in time-to-first-value vs. desktop alternatives
- 89% of users created their first design within 10 minutes
- 45% lower abandonment rate during trial signup
Onboarding Optimization:
- No credit card required for free accounts
- Template library for immediate value demonstration
- Interactive tutorials within the design interface
- Progressive feature disclosure preventing overwhelm
Pillar 2: Collaboration as Core Differentiator
Real-Time Multiplayer Editing: Figma treated design like Google Docs—multiple users could edit simultaneously with live cursors, comments, and changes.
Technical Innovation:
- Built on WebGL for performance
- Operational transformation for conflict resolution
- Real-time synchronization across all connected users
- Browser-based vector editing with desktop-quality performance
Collaboration Features:
- Live cursors showing team member activity
- Contextual commenting and feedback
- Version history with automatic saves
- Real-time component and style library sync
Pillar 3: File Sharing as Viral Growth Engine
The “View-Only” Viral Loop: Every shared Figma file became a product demonstration:
- Designer shares file link with stakeholders
- Stakeholders view design in browser (no account required)
- Stakeholders add comments or feedback (account creation prompt)
- Stakeholders see collaboration value and create accounts
- New users invite their own team members
This follows the systematic growth loop acquisition framework that many successful PLG companies use.
Viral Coefficient Evolution:
- 2016: 1.2 (each user invited 1.2 new users)
- 2018: 1.8 (improved sharing experience)
- 2020: 2.3 (peak viral performance during COVID remote work)
- 2022: 2.1 (market saturation effects)
Implementation Details: The Systematic Rollout
Phase 1: Product Foundation (2016-2017)
Technical Infrastructure:
- WebGL-based rendering engine for browser performance
- Real-time collaboration architecture
- Cloud-native file storage and synchronization
- Cross-platform compatibility (Windows, Mac, Chrome OS)
Early User Acquisition:
- Designer Hangouts community outreach
- Dribbble and Behance portfolio integration
- Product Hunt launch (#1 Product of the Day)
- Targeted ads to Sketch and Adobe users
Initial Metrics (End of 2017):
- 100,000+ registered users
- 15% monthly active user rate
- 8 minutes average time-to-first-design
- 23% week-1 retention rate
Compare these metrics with startup benchmarks by industry to understand Figma’s early performance.
Phase 2: Viral Optimization (2018-2019)
Sharing Experience Enhancement:
- One-click link sharing with permission controls
- Embed capabilities for websites and presentations
- Mobile viewing optimization
- Guest commenting without account requirements
Team Features Development:
- Team libraries for design systems
- Organization-level user management
- Advanced permissions and access controls
- Usage analytics and reporting
Growth Acceleration Tactics:
- Referral program with additional storage rewards
- Template marketplace with user-generated content
- Integration with popular tools (Slack, Notion, Zoom)
- Conference speaking and design community engagement
Key Metrics (End of 2019):
- 1+ million registered users
- 3.2 designs created per user per week
- 67% of teams upgraded to paid plans within 90 days
- $12 average revenue per user (ARPU)
Phase 3: Enterprise Penetration (2020-2022)
Enterprise Feature Development:
- Single sign-on (SSO) integration
- Advanced security and compliance (SOC 2, GDPR)
- Design system management at scale
- Developer handoff tools (inspection, code generation)
COVID-19 Growth Acceleration: The pandemic accelerated remote work adoption, perfectly positioning Figma’s collaborative advantages.
Remote Work Impact:
- 300% increase in new team signups (March-May 2020)
- 150% growth in daily active users
- 89% of Fortune 500 companies adopted Figma during pandemic
- $200M ARR reached by end of 2020
Learn how other startups can optimize customer acquisition costs during market opportunities.
Enterprise Sales Integration: While maintaining PLG foundation, Figma added enterprise sales for large accounts:
- Product-qualified lead (PQL) identification
- Usage-based sales triggers
- Bottom-up adoption with top-down sales support
- Customer success integration for expansion
Growth Metrics & Results Analysis
User Growth Trajectory
Registration Growth:
- 2016: 10,000 users (beta launch)
- 2017: 100,000 users
- 2018: 500,000 users
- 2019: 1,000,000 users
- 2020: 3,000,000 users (COVID acceleration)
- 2022: 4,000,000+ users (acquisition)
Activation and Retention:
- Time to First Value: 8 minutes average
- 7-Day Retention: 65% (industry benchmark: 35%)
- 30-Day Retention: 45% (industry benchmark: 25%)
- Annual Retention: 92% for paid teams
Revenue Growth & Unit Economics
Annual Recurring Revenue (ARR):
- 2017: $1M ARR
- 2018: $10M ARR
- 2019: $40M ARR
- 2020: $200M ARR
- 2022: $400M ARR (at acquisition)
Customer Acquisition Cost (CAC):
- Organic (referral): $12 per user
- Paid marketing: $48 per user
- Enterprise sales: $2,400 per account
- Blended CAC: $35 per user
Compare with customer acquisition cost benchmarks by industry to see how Figma’s efficiency compares.
Customer Lifetime Value (CLV):
- Individual plans: $420 LTV
- Team plans: $1,680 LTV
- Enterprise plans: $24,000+ LTV
- LTV:CAC ratio: 12:1 (exceptional for SaaS)
Market Penetration Metrics
Design Tool Market Share (by active users, 2022):
- Figma: 47% (up from 0% in 2016)
- Adobe Creative Suite: 32% (down from 67% in 2016)
- Sketch: 15% (down from 28% in 2016)
- Other tools: 6%
Enterprise Adoption:
- 90%+ of Fortune 500 companies
- 78% of Y Combinator portfolio companies
- 65% of design agencies with 10+ employees
- 89% of remote-first companies
Compare with typical startup-to-unicorn timelines to understand Figma’s exceptional growth trajectory.
Key Strategic Insights & Lessons
1. Browser-First Architecture as Competitive Advantage
Strategic Decision: Building for web browsers instead of native desktop applications.
Why It Worked:
- Eliminated installation friction
- Enabled real-time collaboration
- Simplified updates and maintenance
- Reduced platform-specific development costs
- Improved accessibility across devices and operating systems
Lesson for Startups: Technical architecture decisions can become sustainable competitive advantages when they enable fundamentally better user experiences.
2. Collaboration as Primary Value Proposition
Strategic Decision: Making collaboration the core feature rather than individual design capabilities.
Why It Worked:
- Addressed unmet need in design workflow
- Created network effects and viral growth
- Increased switching costs once teams adopted
- Enabled premium pricing for team features
- Distinguished from existing single-user tools
Lesson for Startups: Identifying workflow gaps in established markets can create new product categories and competitive advantages.
3. Freemium Model with Natural Upgrade Triggers
Strategic Decision: Generous free tier with team-based limitations driving upgrades.
Freemium Structure:
- Free: 3 files, unlimited personal projects, basic collaboration
- Professional ($12/month): Unlimited files, advanced features, team libraries
- Organization ($45/month): User management, security, advanced permissions
Why It Worked:
- Low barrier to trial and adoption
- Natural upgrade triggers (file limits, team size)
- Value demonstration before payment
- Viral sharing regardless of payment status
Lesson for Startups: Freemium works best when free users create value for paid users through network effects and when upgrade triggers align with increasing usage and value.
Learn more about systematic customer acquisition strategies that balance free and paid user value.
4. File Sharing as Viral Growth Mechanism
Strategic Decision: Making file sharing seamless and requiring no recipient setup.
Viral Mechanics:
- One-click sharing with permission controls
- View-only access without account requirements
- Commenting and feedback features prompting signup
- Natural exposure to product value through shared files
Why It Worked:
- Every shared file became a product demonstration
- Reduced friction for stakeholder participation
- Created organic word-of-mouth marketing
- Enabled bottom-up adoption in organizations
Lesson for Startups: The best viral features are core to user workflow, not bolt-on referral programs. When sharing your work requires sharing your tool, growth becomes automatic.
5. Enterprise Sales Integration with PLG Foundation
Strategic Decision: Adding enterprise sales while maintaining product-led acquisition.
Hybrid Approach:
- Product-led acquisition for individual users and small teams
- Usage-based identification of enterprise prospects
- Sales team focused on large accounts and complex implementations
- Customer success driving expansion within existing accounts
Why It Worked:
- Maintained low CAC for small accounts
- Enabled large deal capture and expansion
- Provided implementation support for complex organizations
- Preserved viral growth mechanics
Lesson for Startups: PLG and enterprise sales can complement each other when sales focuses on accounts already demonstrating product value through usage.
Explore how to balance customer acquisition vs retention costs when scaling from PLG to enterprise sales.
Common Mistakes Avoided
1. Feature Parity Trap
What Figma Avoided: Trying to replicate every Adobe feature before launching.
Instead They: Focused on collaboration use cases and gradually expanded feature set based on user feedback.
Why This Mattered: Allowed faster time-to-market and user-driven product development rather than competitor-driven feature lists.
2. Desktop Application Assumption
What Figma Avoided: Building native desktop applications like competitors.
Instead They: Bet on browser capabilities and web-based architecture.
Why This Mattered: Enabled real-time collaboration, simplified deployment, and reduced development complexity.
3. Individual User Focus
What Figma Avoided: Optimizing solely for individual designer productivity.
Instead They: Designed for team collaboration from day one.
Why This Mattered: Created network effects, viral growth, and higher customer lifetime value through team adoption.
4. Traditional Enterprise Sales Approach
What Figma Avoided: Leading with enterprise sales and gating features behind high prices.
Instead They: Used freemium PLG to drive adoption, then layered enterprise sales for large accounts.
Why This Mattered: Maintained viral growth and organic adoption while capturing enterprise value.
Implementation Framework for Startups
When Figma’s PLG Strategy Applies
Use Figma’s approach when:
- Your product has clear collaboration benefits
- Sharing work naturally exposes others to your tool
- Network effects increase product value
- Technical differentiation creates sustainable advantages
- Market incumbents focus on individual rather than team value
Reference our complete startup growth strategy guide to determine if PLG is right for your startup.
Don’t use this approach when:
- Your product is purely individual-focused
- Sharing doesn’t demonstrate core value
- Technical barriers prevent browser-based delivery
- Market requires extensive customization or integration
Replicable Framework Elements
1. Collaboration-First Product Design
- Identify workflow gaps in team-based activities
- Build real-time collaboration into core functionality
- Design sharing mechanisms that demonstrate value
- Create natural network effects through usage
2. Frictionless Trial Experience
- Eliminate download and installation requirements
- Provide immediate value demonstration
- Use progressive disclosure for complex features
- Remove credit card requirements for initial trial
3. Viral Sharing Mechanics
- Make sharing core to user workflow
- Allow value demonstration without recipient signup
- Create natural upgrade triggers through usage limits
- Enable stakeholder participation in shared work
Implement proven growth loop acquisition frameworks to build systematic viral mechanisms.
4. Systematic Feature Development
- Focus on differentiation rather than feature parity
- Build based on user feedback and usage data
- Maintain core value proposition while expanding capabilities
- Integrate enterprise features without breaking PLG model
Action Plan: Implementing Figma’s Strategy
Phase 1: Foundation (Months 1-6)
- Identify collaboration gaps in your target market
- Design core product with sharing and collaboration features
- Build browser-based or low-friction access experience
- Create freemium model with natural upgrade triggers
- Implement basic viral sharing mechanisms
Use our TAM SAM SOM market sizing framework to validate market opportunity.
Phase 2: Growth Optimization (Months 7-18)
- Optimize onboarding for time-to-first-value
- Enhance sharing experience and viral coefficients
- Add team management and collaboration features
- Implement usage analytics and user feedback systems
- Begin content marketing and community engagement
Apply three-pillar domain authority strategies for organic growth.
Phase 3: Scale and Enterprise (Months 19+)
- Develop enterprise security and compliance features
- Integrate sales team for large account opportunities
- Create customer success programs for expansion
- Build integration ecosystem and API platform
- Establish thought leadership in your category
Success Metrics to Track
Product Metrics:
- Time to first value (target: <10 minutes)
- Viral coefficient (target: >1.5)
- 7-day retention (target: >50%)
- Feature adoption rates
Track these against startup metrics and KPIs benchmarks for your industry.
Growth Metrics:
- Monthly active users growth
- Freemium to paid conversion rate
- Customer acquisition cost by channel
- Net revenue retention rate
Business Metrics:
- Annual recurring revenue growth
- Customer lifetime value
- Market share progression
- Enterprise account penetration
Conclusion: The Systematic Disruption Playbook
Figma’s $20 billion acquisition wasn’t the result of luck or timing—it was the systematic execution of product-led growth strategy over six years. By focusing on collaboration, eliminating friction, and creating viral sharing mechanisms, Figma built sustainable competitive advantages that even Adobe’s resources couldn’t overcome.
The key insight for startups: established markets with entrenched players can be disrupted when new technology enables fundamentally better user experiences. But success requires systematic execution of PLG principles, not just a better product.
Figma’s systematic approach proves that:
- Technical architecture decisions create lasting advantages
- Collaboration features drive network effects and viral growth
- Freemium models work when upgrade triggers align with value
- File sharing can be more powerful than referral programs
- PLG and enterprise sales can work together effectively
For startups challenging established markets, Figma’s playbook provides a proven framework for systematic disruption through product-led growth.
Ready to implement systematic growth strategies?
Explore our complete startup growth strategy guide for frameworks on choosing between product-led, community-led, and channel-led growth approaches.
Learn more about viral growth mechanisms and how to build systematic viral loops for your startup.
Compare your metrics with startup benchmarks by industry to set realistic growth targets.
Discover data-proven startup growth strategies from other successful companies.